Smart Chart Setup
Set up your chart
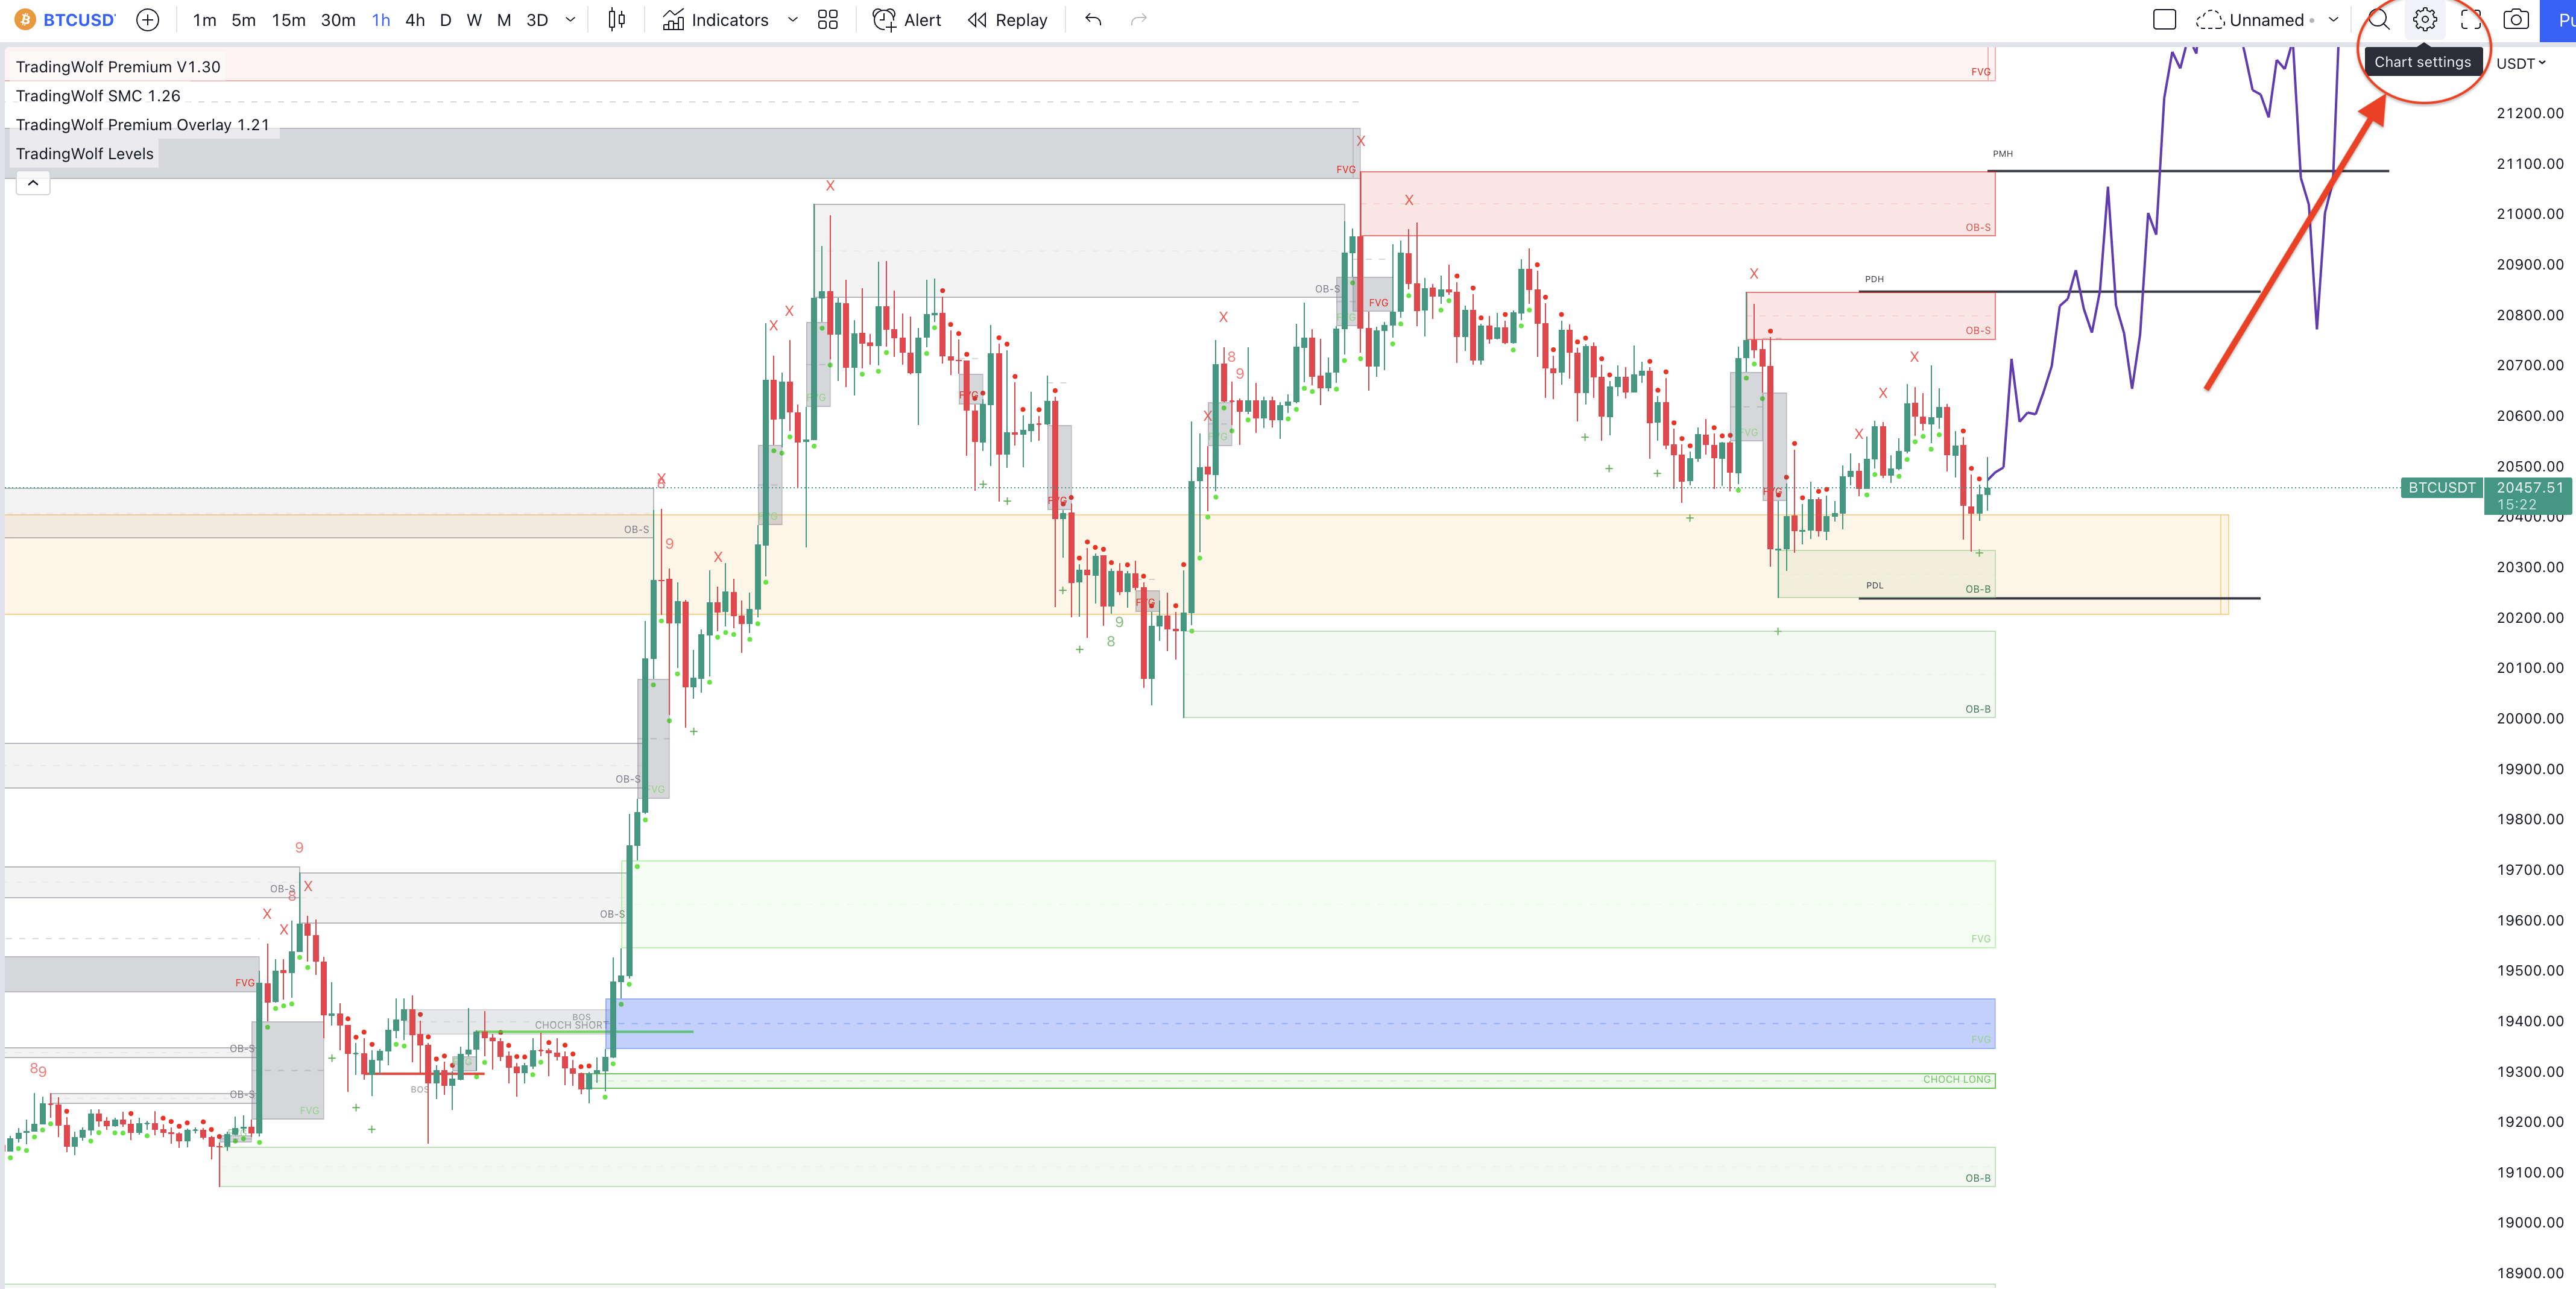
Here we are going to show you how we recommend setting up your chart, obviously feel free to edit these how you want as a lot of it will come down to personal preference. We like have a clean chart so will be sharing how we personally use ours. One of the first things you will want to do is go to 'Chart Settings' in the top right corner as seen in the image belo
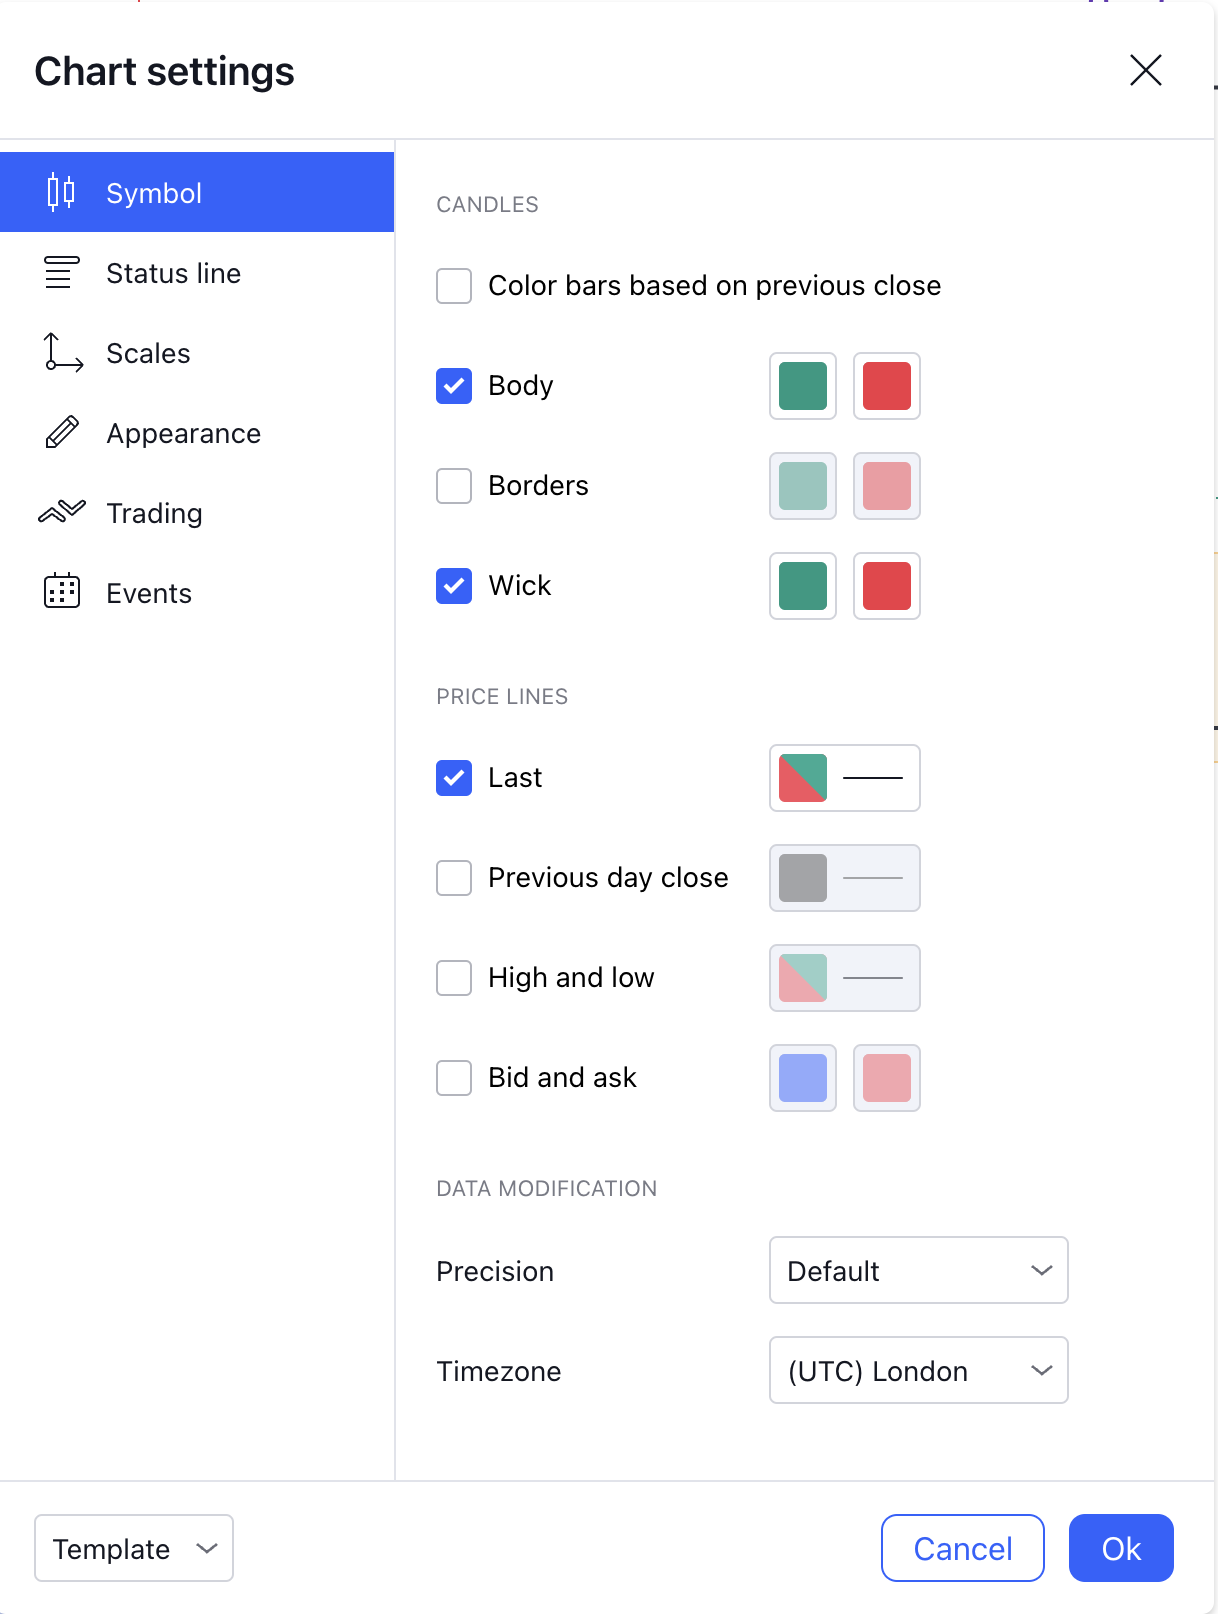
Symbol
From here you should arrive on this 'Symbol' tab, here you can change the colours of your candles, borders and wicks. The only change we recommend making here is removing the border outline. This is because if you want to use the 'Trend Candles' removing the borders of the candles keeps the indicator a much more flush look.
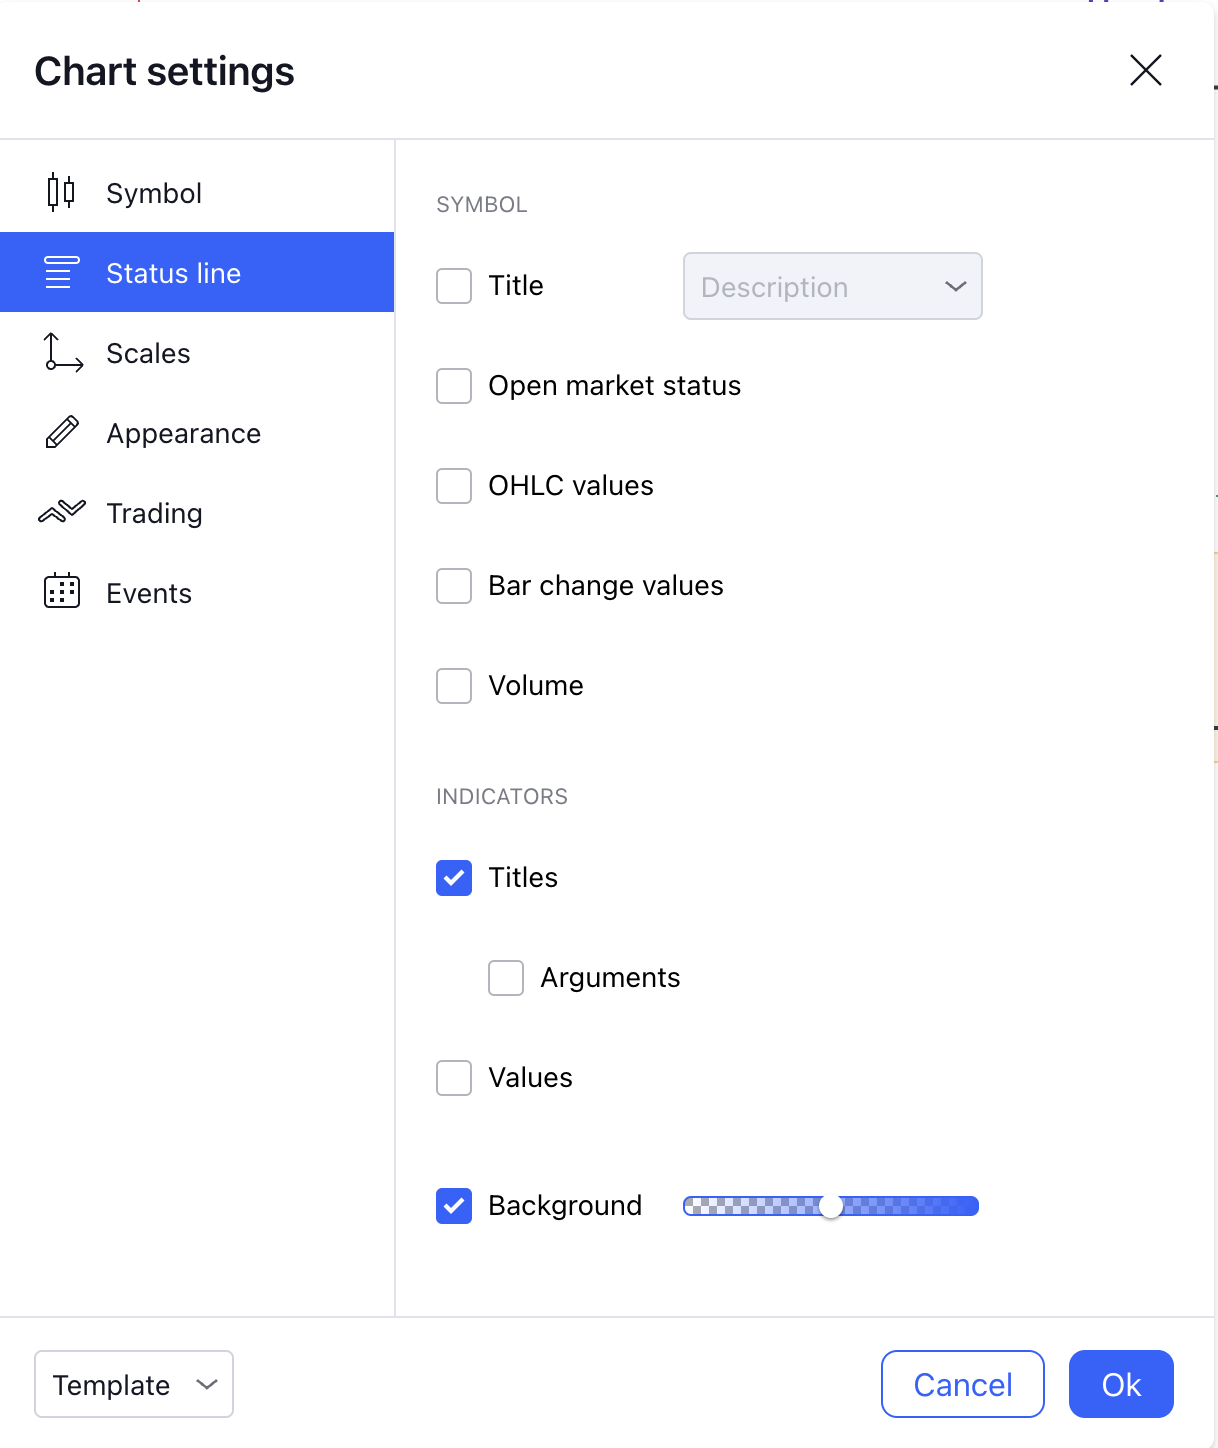
Status Line
Next tab down is the 'Status line' these are the values which you see in the top left corner and the values next to any indicator you have on your chart. They can be useful for developers but they look a bit messy if you don't need them. We have them all disabled apart from 'Titles and 'Background'. You will find this gives you a lot more space on your chart and its a lot less clustered already. 'Titles' will keep the names of the indicators up so you can easily remove/add any you want and the background just keeps their area behind the name a slightly shaded colour so make them more clear to read. You may want to disable this too.
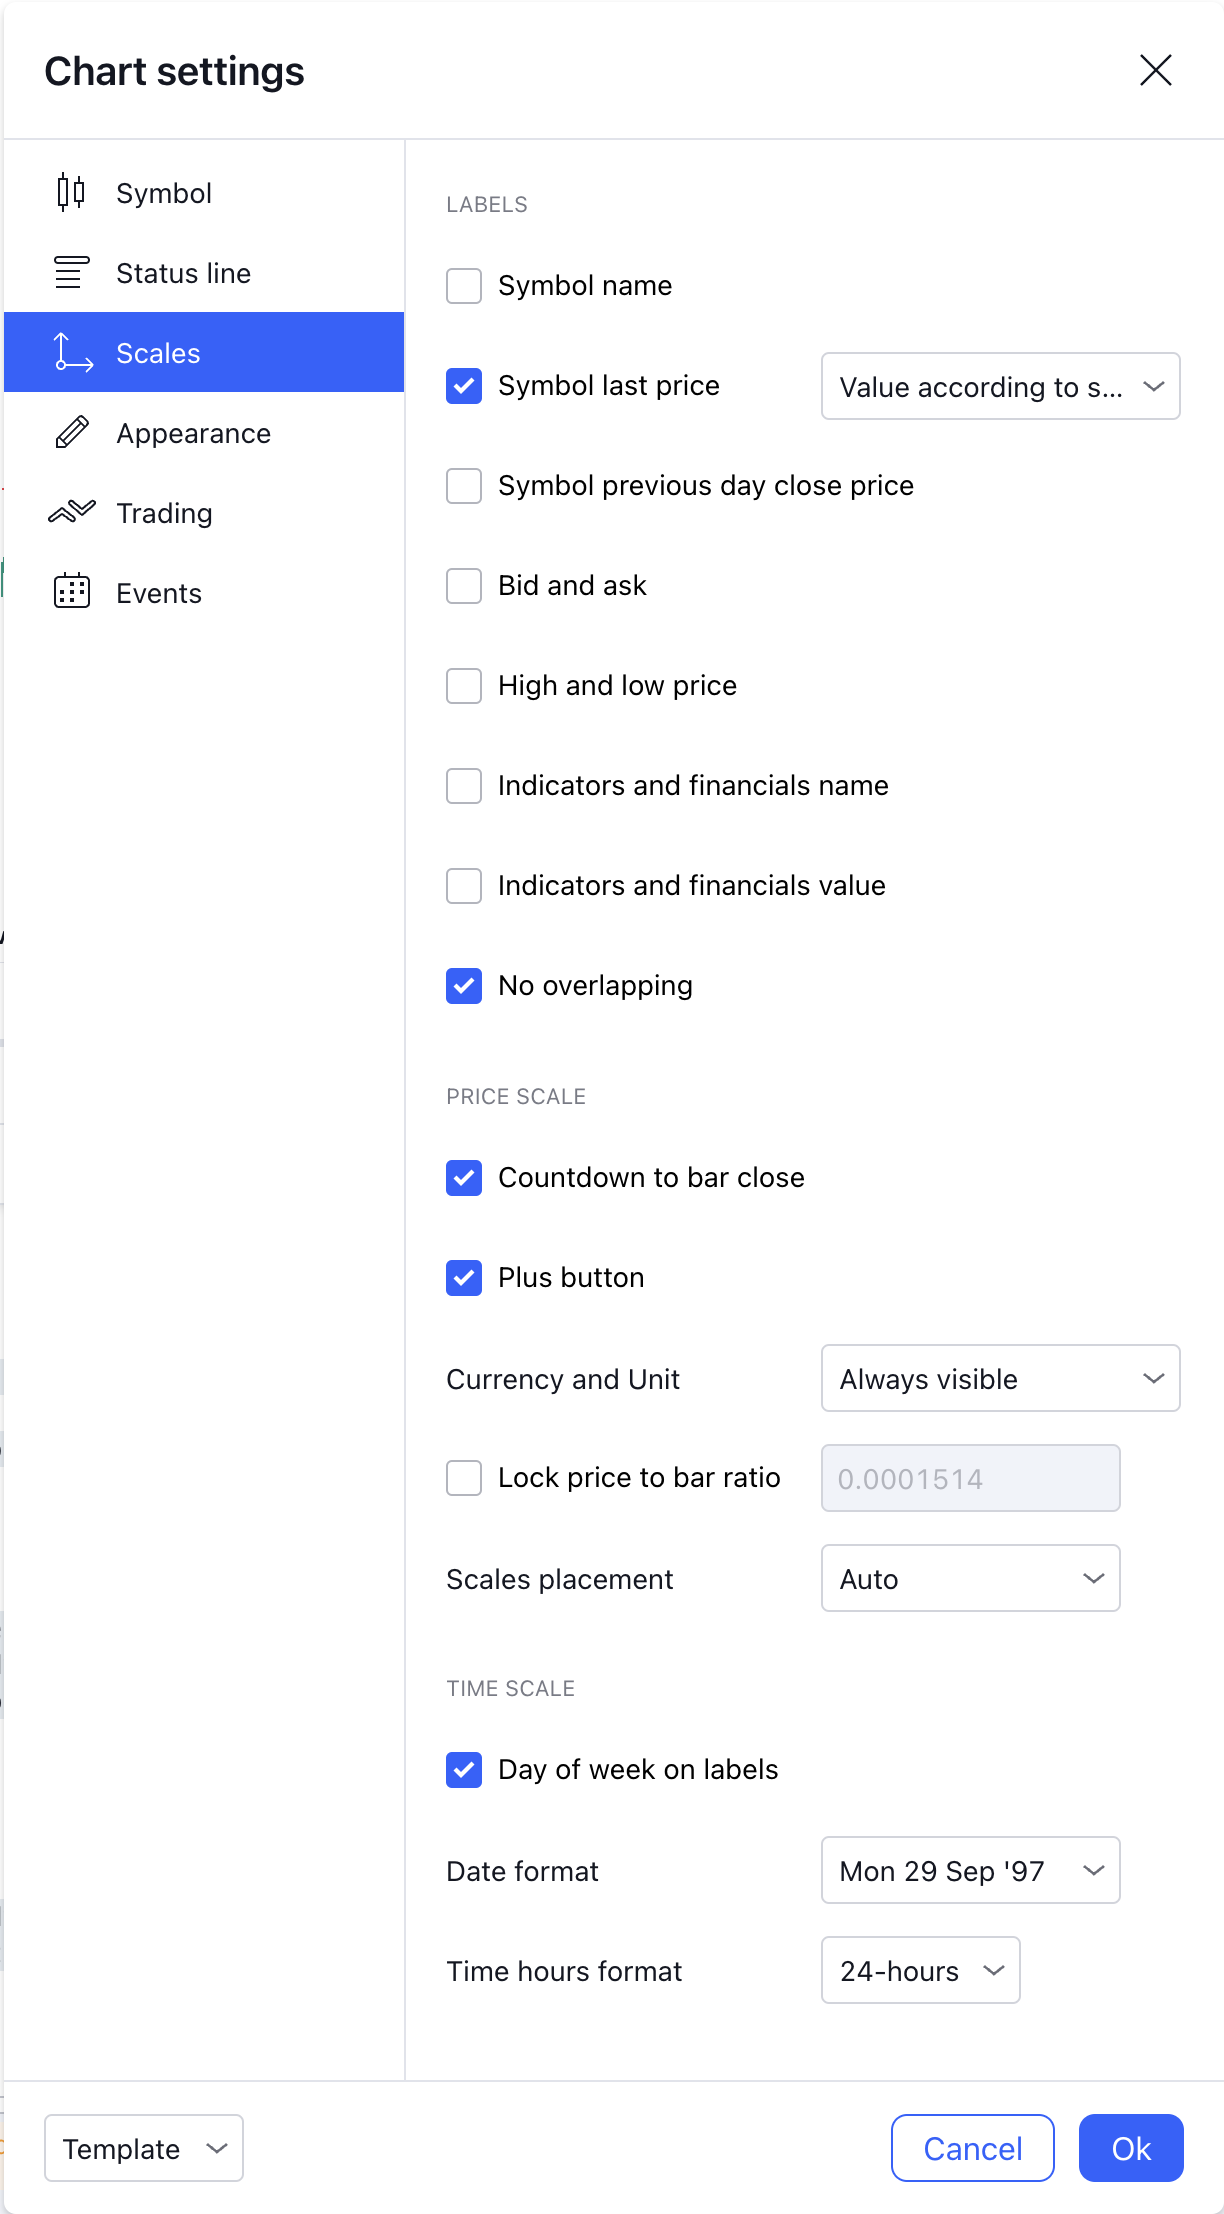
Scales
The 'Scales' tab below changes what you see across your Scales... surpising... Under the labels options we only have 'Symbol last price' and 'No overlapping' on. Below that we have the 'Countdown to bar close' on but this is very much optional, the 'Plus button' gives you quick access to create alerts which is why we keep it there. Then at the bottom of this tab you have the 'Time scale' settings, these are purely down to your personal preference and wont make a difference to the TradingWolf display.
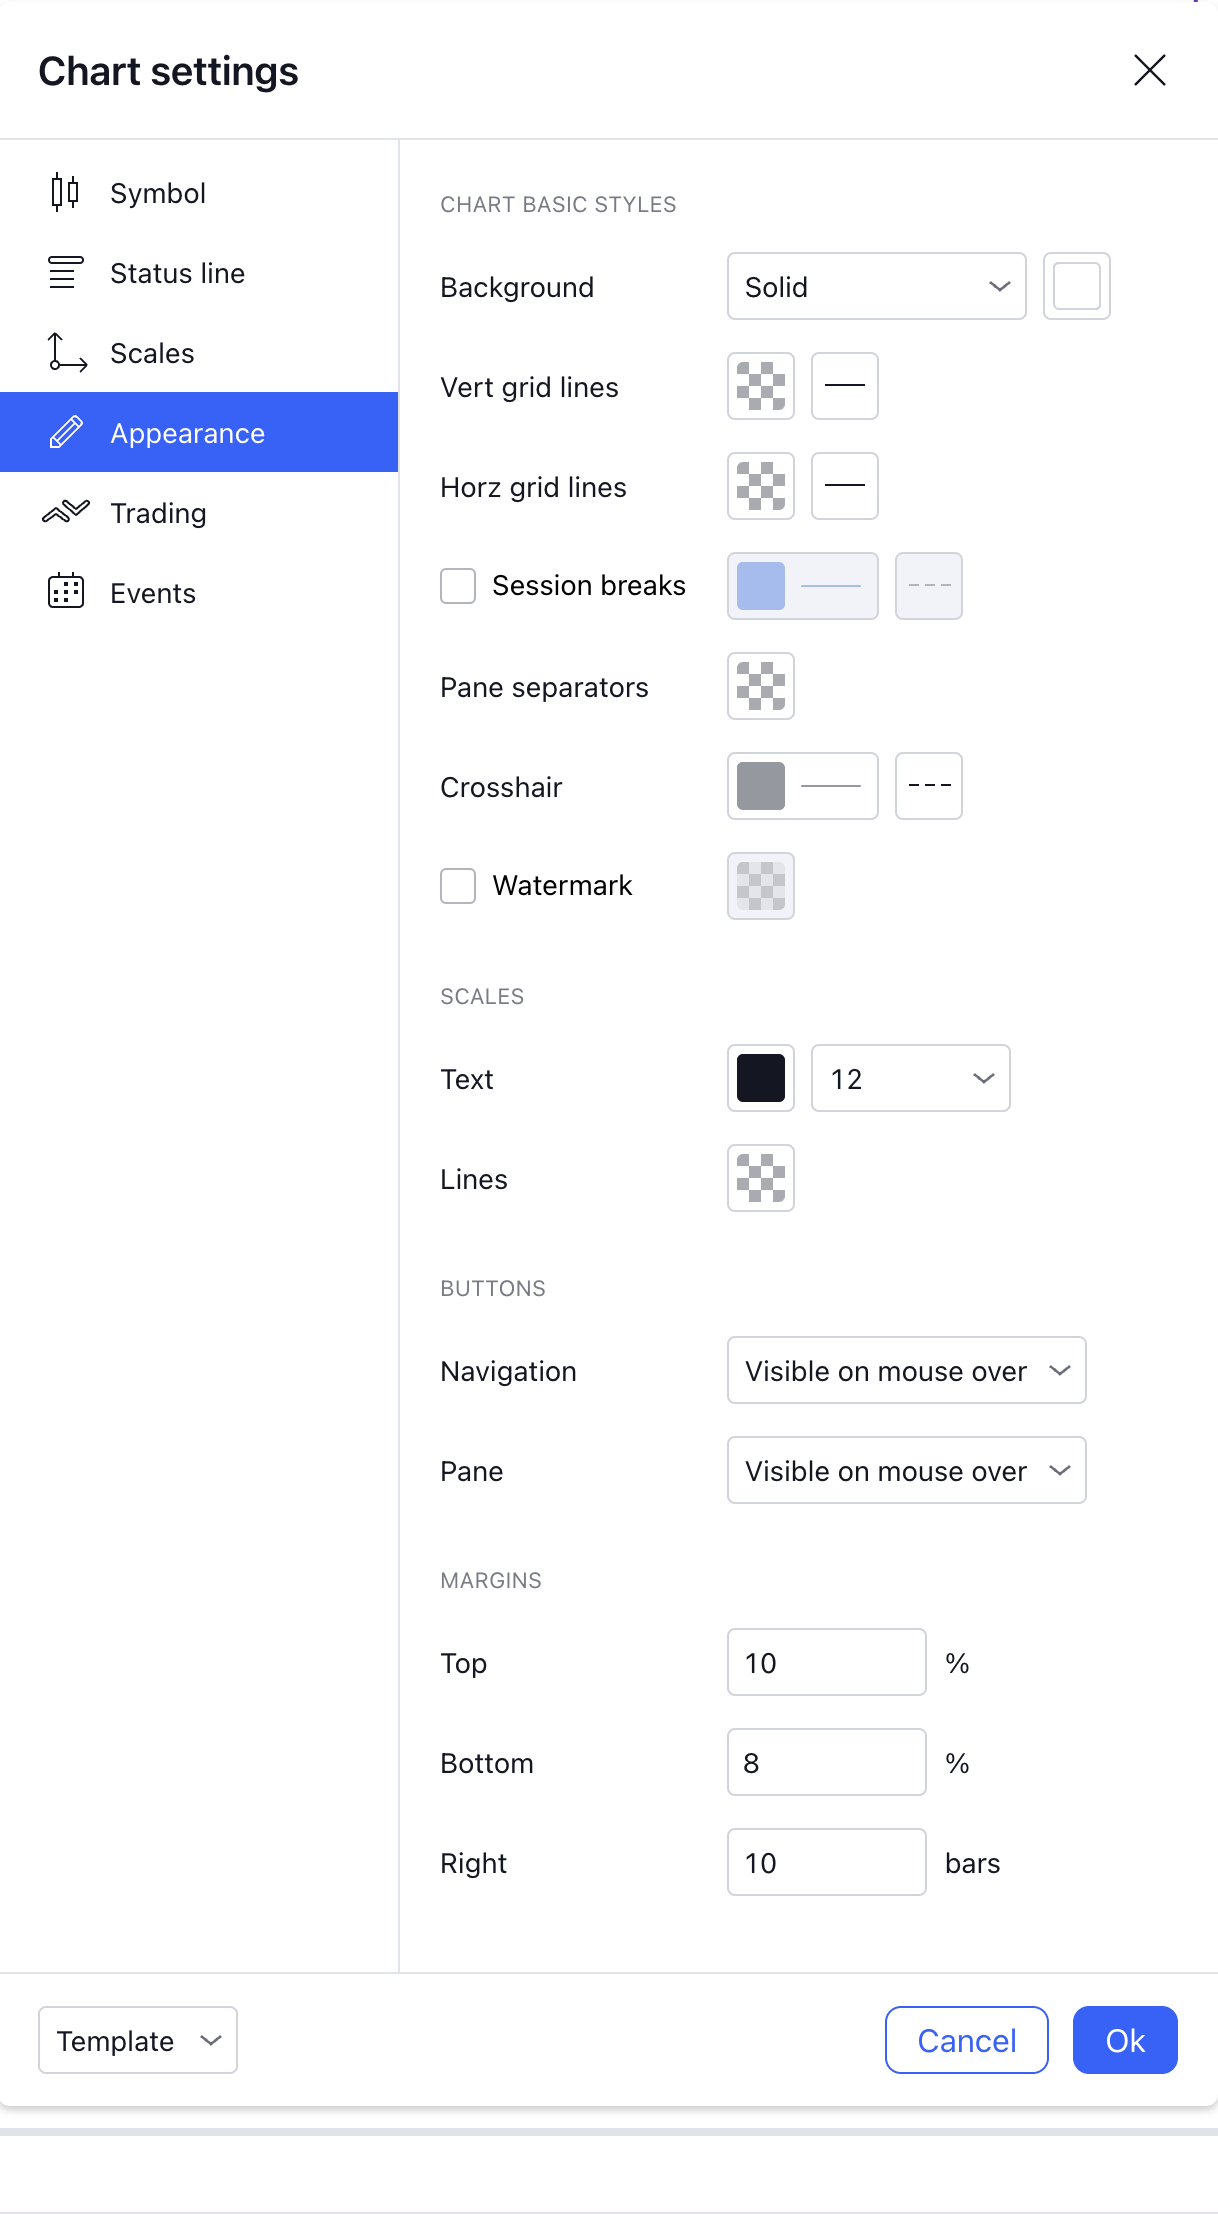
Appearance
The 'Appearnace' tab is one of the most important when it comes to setting up your chart. At the top you can change the background of your chart, some people like dark theme, if you do thats fair enough but it will mean you want to change some of the colours from the TradingWolf indicators to work better with a dark background. They have been optimised for clear white backgrounds. To get this you want to make sure the drop down box is on 'Solid' and simply set the colour to white.
The 'Vert' and 'Horz' lines we set the colours opacity to 0%. 'Session Breaks' and 'Watermark' we have disabled The text size will affect how many price levels you see but this can also be affected by your monitors size you play around with this until you find a balance you like. The lines of the X & Y axis we set the colours opacity to 0% again. The rest of the settings we leave to default but again depending on your screen size, you may want to edit the margins.
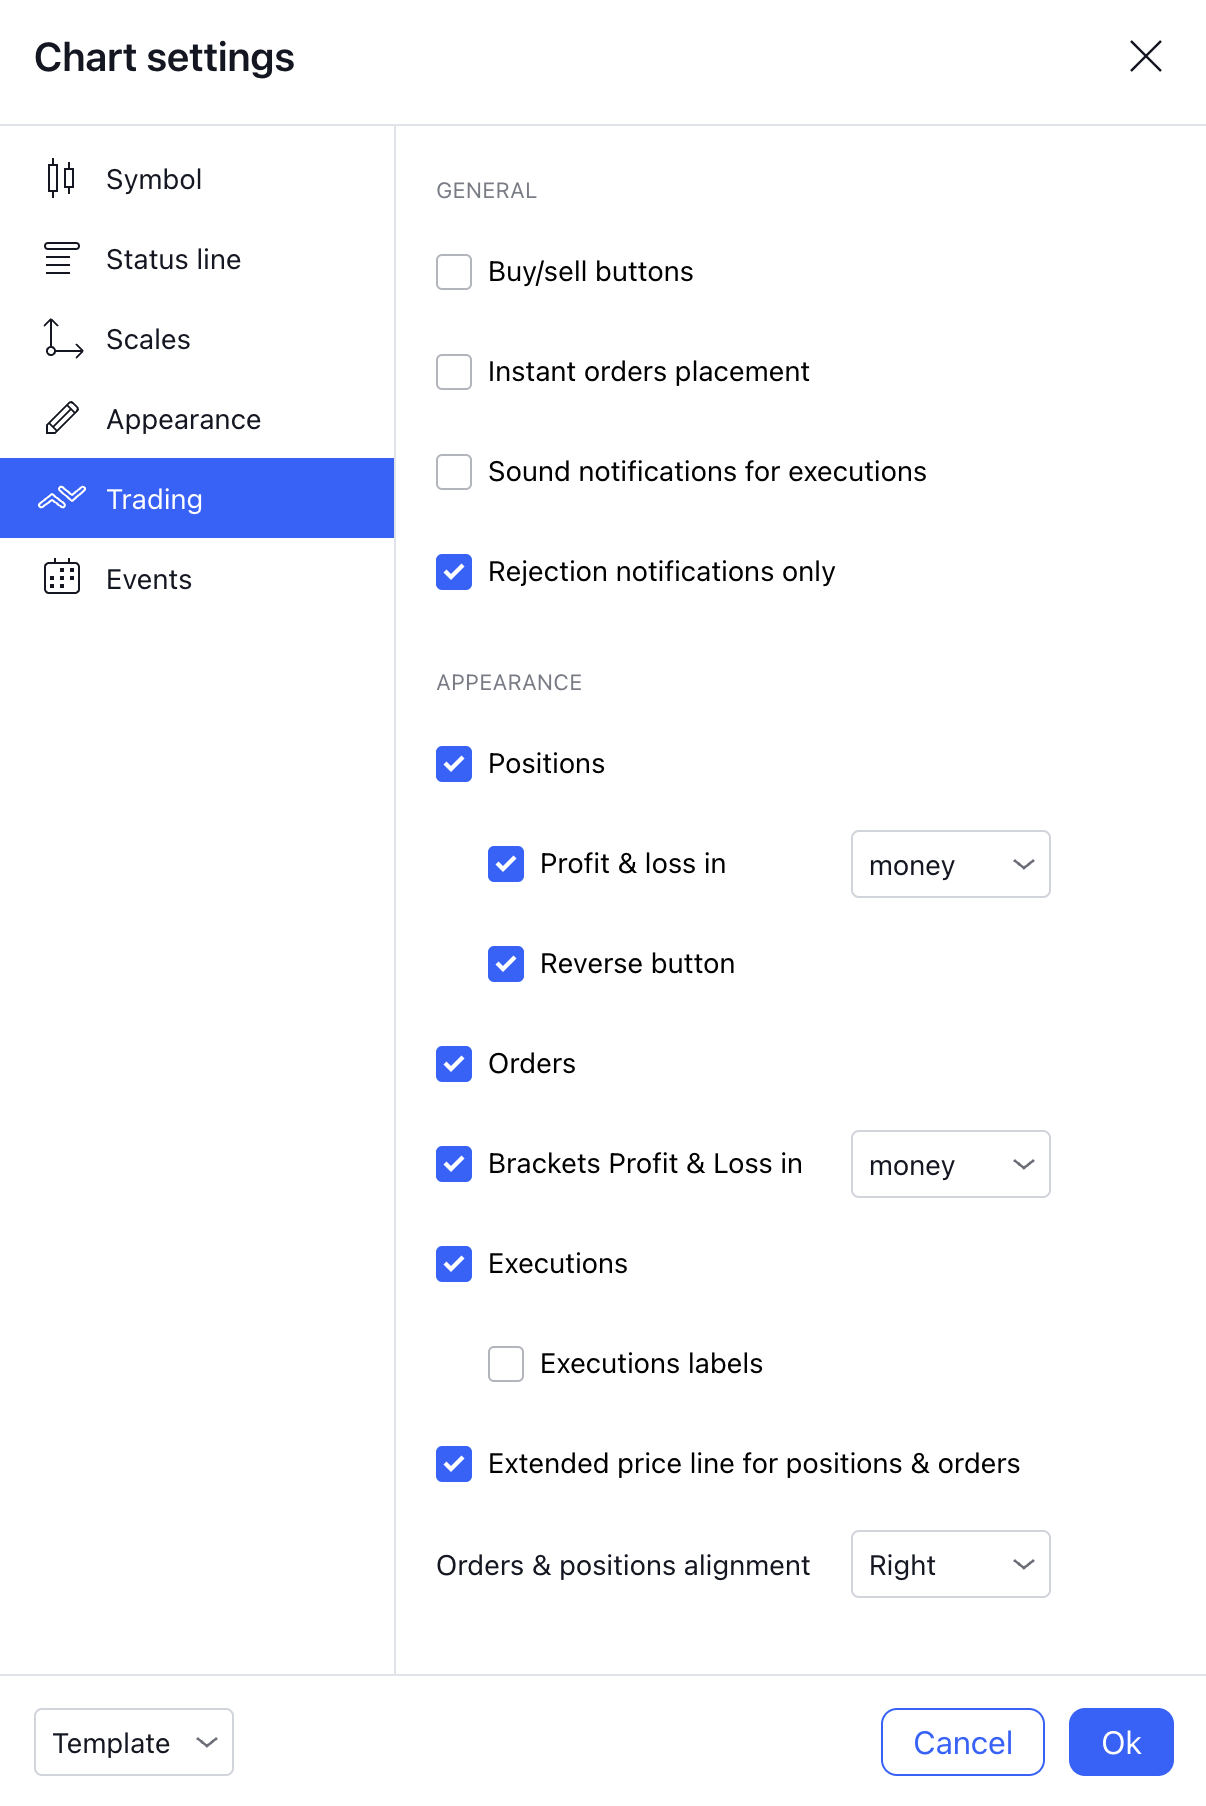
Trading
The 'Trading' tab below doesn't affect Tradingwolfs indicators at all. It is there for people who would like to directly trade through Tradingview to their exchange.
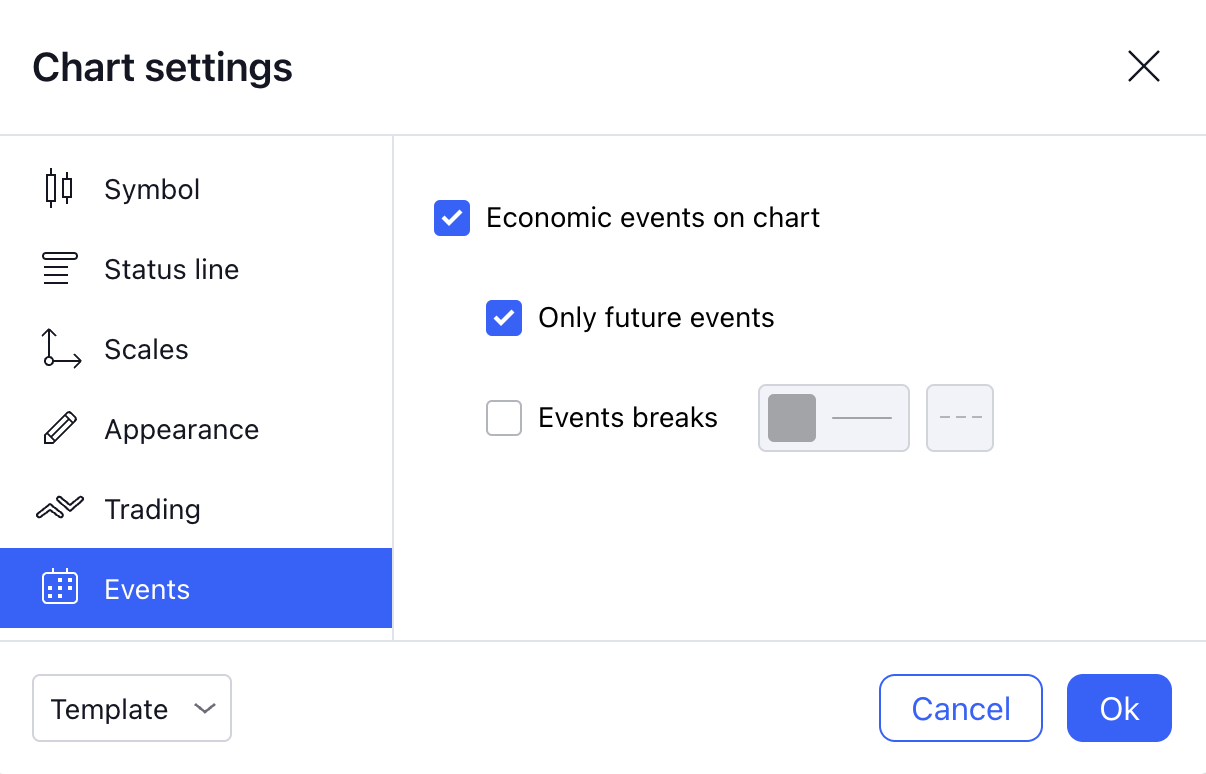
Events
The final 'Events' tab gives you the option to display economic events on the chart. A typical example of this are a companies 'Earnings & Revenue' reports.